Or, everything you wanted to know about setting up Ganglia, but couldn't grok from the official documentation - part 1.
I recently set up Ganglia monitoring on couple of new machines I'm looking after. While I've used Ganglia before, I wanted to do some slightly non-standard things this time around. This in turn reminded me that the official documentation is a bit jargon-heavy, so I felt it was worth writing up my take on what you should know about it as a newcomer.
In this post I'll cover:
- What Ganglia is for.
- Alternative cluster monitoring tools, and how they overlap.
(See part 2 for details on how the Ganglia utils work together, and how to set up a minimal configuration.)
Ganglia is an open-source collection of tools for collecting performance metrics on all the machines in a cluster - CPU and RAM usage, network IO, disk space remaining etc. These are typically interpreted via a web-based frontend 'dashboard' page in your browser like so (click through for big version):
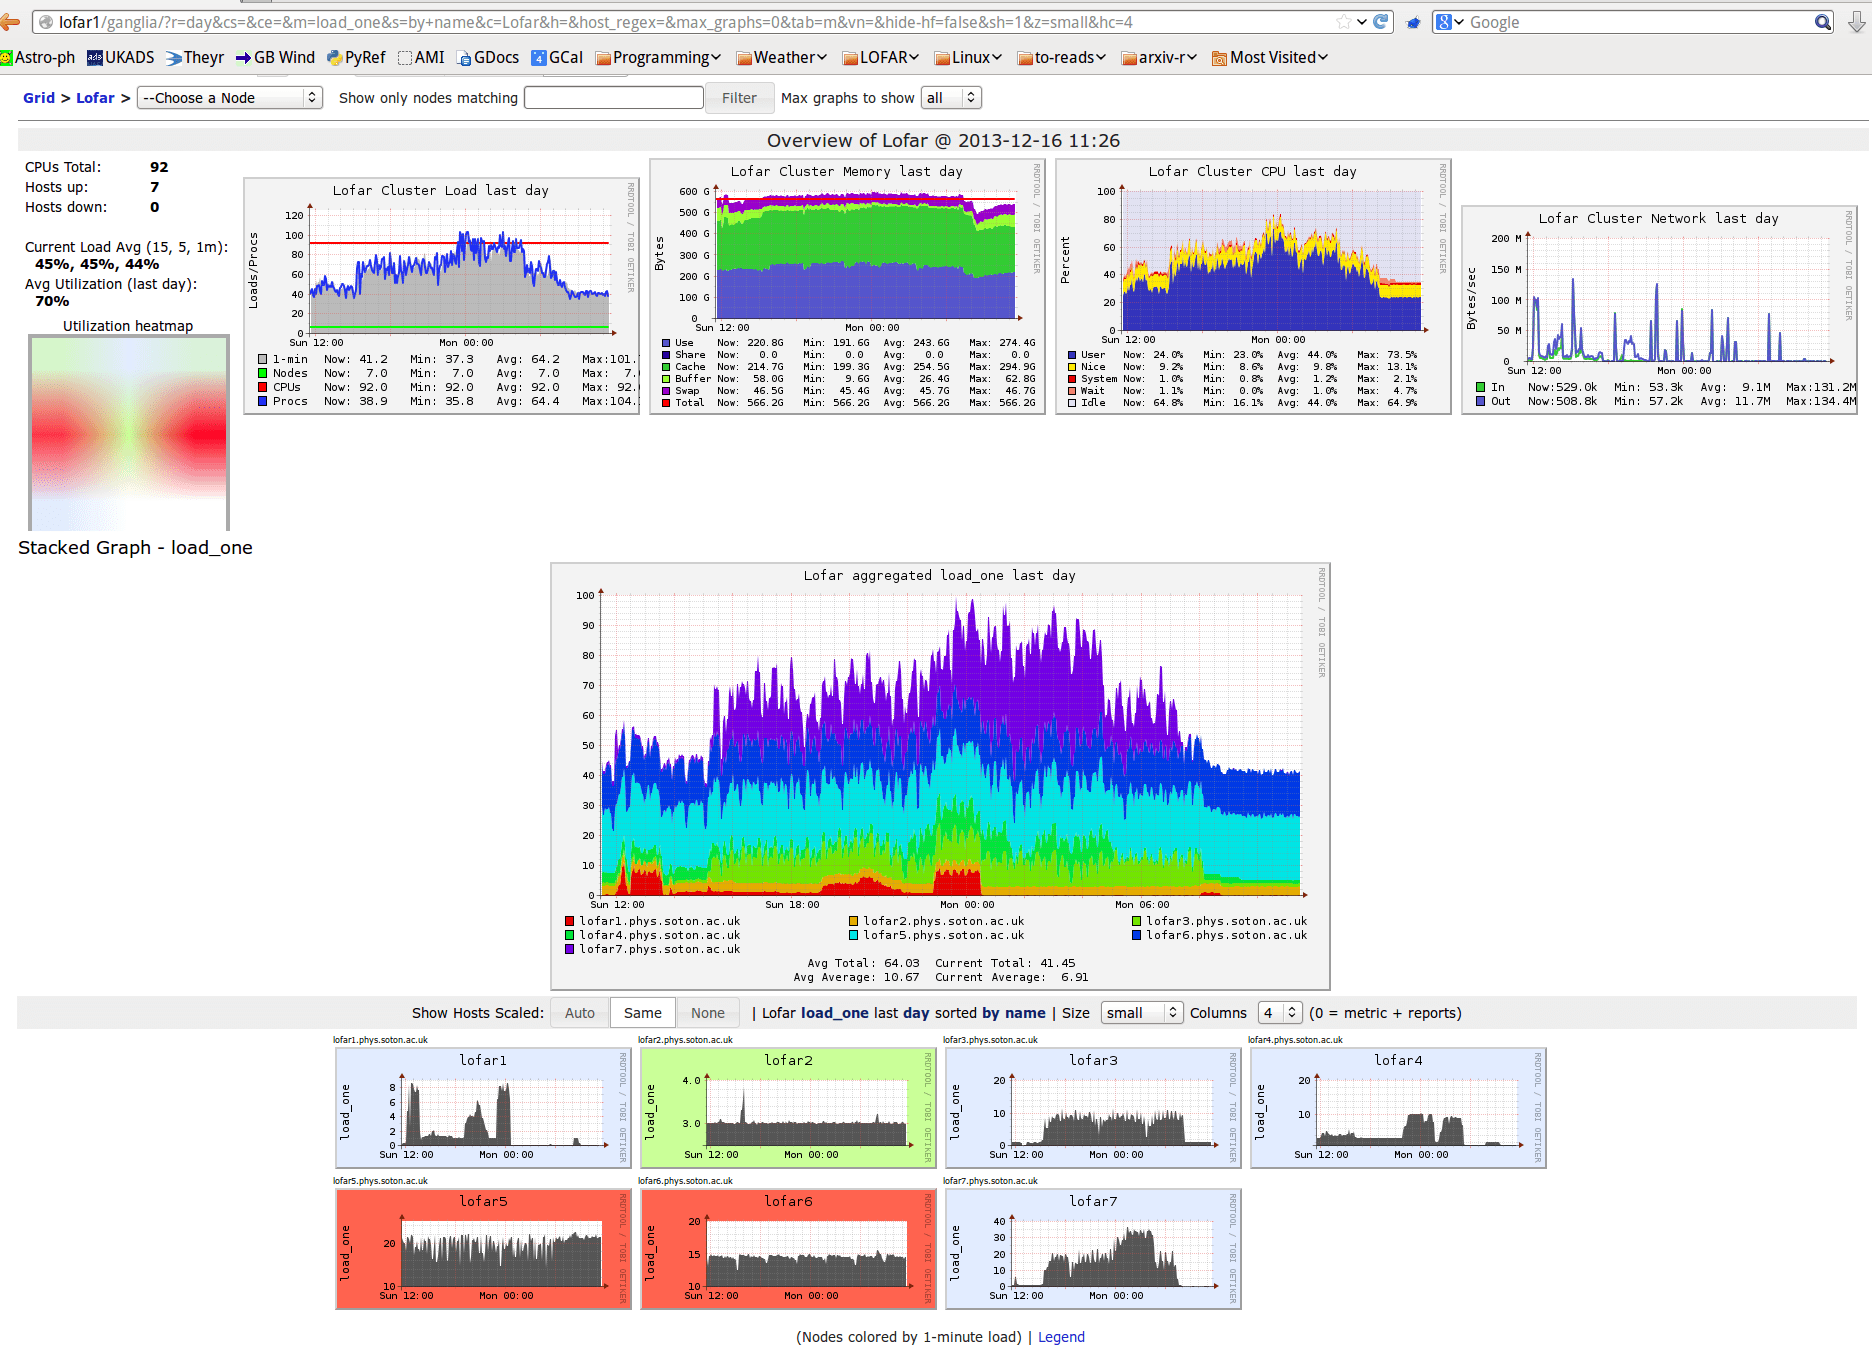
as well as historical graphs that allow you to inspect the metrics over a range of timescales, either on a single-machine basis or averaged over the cluster.
For me, this has at least three major benefits.
- You can gather the data to decide e.g. whether you really need more processing machines, or just need better load balancing / task queueing,
- When debugging unexpected program crashes, you can determine whether they are simply due to a lack of system resources, e.g. some process hogging all the RAM, or a database store filling your primary disk to 100%.
- If you're not using a formal CPU allocation / queueing mechanism, you can just point your users at the status page and they can make an informed decision about which machine they should run their data-crunching on.
It's worth mentioning that there are several competing (and also open source) software packages that address these kind of problems, or overlap somewhat.
As far as I can tell, Cacti and Munin are pretty much directly comparable to Ganglia. I can't give any first-hand impressions, and Googling suggests no-one has written up a particularly useful comparison, unfortunately. Twitter perhaps suggests a slight favouring of Ganglia.
I will say that Munin appears to have an active Github community (402 stars as opposed to Ganglia's 128), and I was almost convinced to try it out this time around as I struggled with the Ganglia documentation, since the configuration looks more straightforward at first glance. However, a couple of things put me off. Firstly, the FAQ suggests default configuration only provides updates every 5 minutes. Ganglia updates about every 20 seconds, which is much better if you're using it as a real-time dashboard. (Further inspection suggests this is both configurable and perhaps not even default anymore, but who reads a bug-report when they're skimming FAQ's?)
There are also some slightly hazy, not particularly quantitative claims about how Ganglia is supposed to be highly scalable, due to the way it can be configured hierarchically - nodes reporting to clusters, clusters reporting to grids, grids being summarised on the uber-dashboard. Which is probably true, but it's unclear if we're talking 10's, 100's or 1000's of nodes before this would be an issue for Munin etc - or if that's just outdated FUD and Munin scales just as well.
But anyway, Ganglia works well for me - and once you understand the config files setting it up is very quick and easy; see part 2.
EDIT: On further googling, I came across this: http://www.igvita.com/2010/01/28/cluster-monitoring-with-ganglia-ruby/ - I think everything I've said here agrees with the assertions there, and that guy's a 'web performance engineer' at Google, so make of that what you will.
While I'm here, I might as well mention Nagios, which exists in a similar space but is more focused on alerting you when things are broken, rather than logging history. Finally, there are some 'hot new technologies' in the logging/graphing space, in the form of statsd and Graphite, which look potentially appealing - but they're not in the standard package repositories yet, and I haven't yet had time or inclination to investigate them.